- Value Investor Daily
- Posts
- Value Investor Daily #21
Value Investor Daily #21
Markets at All-Time Highs. Are Stocks Overvalued? What Can You Do About It?
Markets are at all-time highs. Is the market overvalued? What should you do about it? Let’s investigate.
Numerous valuation methods indicate that the market is significantly overvalued and has been for a while, even eclipsing levels seen in 2000. The S&P 500 has risen over 29% since its October 2023 lows, reaching an all-time high this week.
The Buffett Indicator
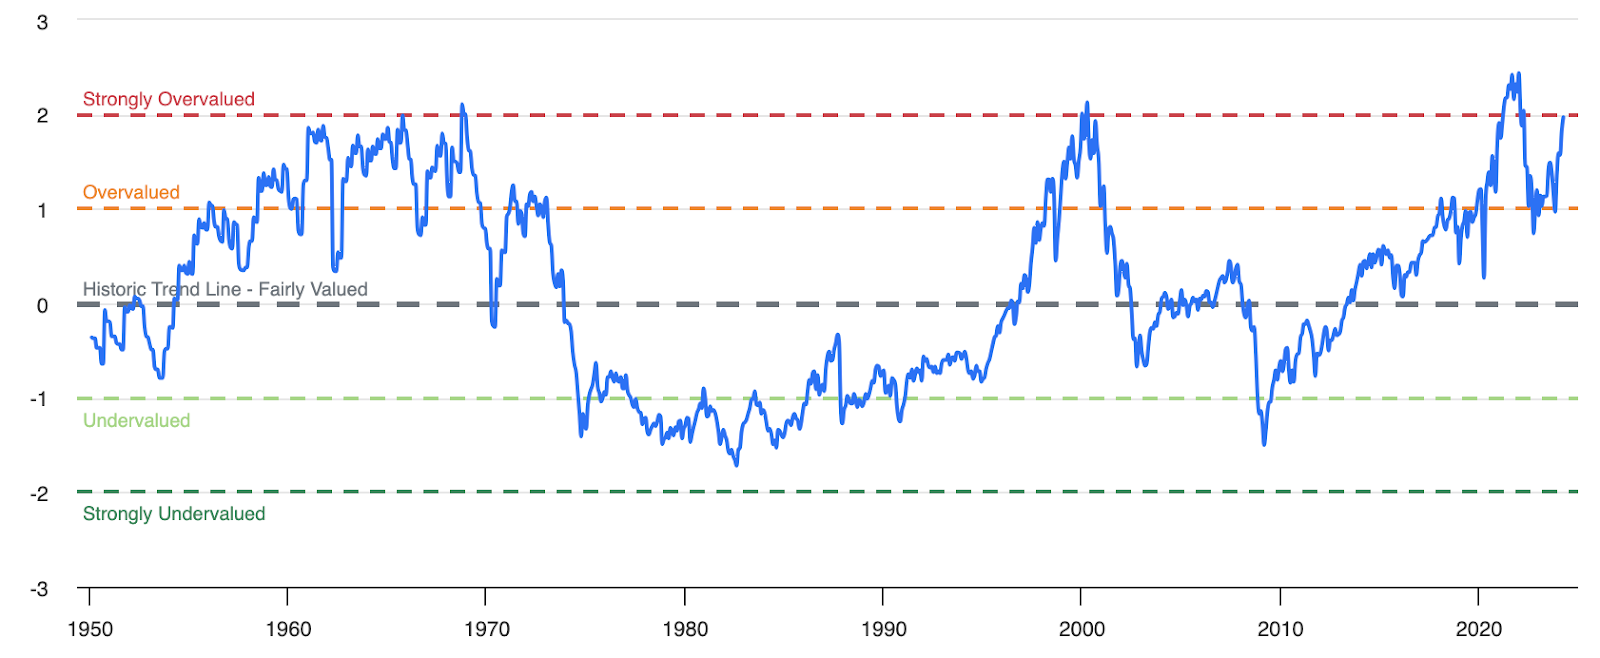
The Buffett Indicator measures the total value of the US stock market relative to the most recent GDP. A high ratio indicates that the stock market is overpriced compared to actual economic productivity.
Currently, the ratio is 197%, which is about 60.88% (or 2.0 standard deviations) above the historical trend, indicating the stock market is strongly overvalued relative to GDP.
Source: currentmarketvaluation.com
10-Year Cyclically Adjusted P/E Ratio (CAPE)
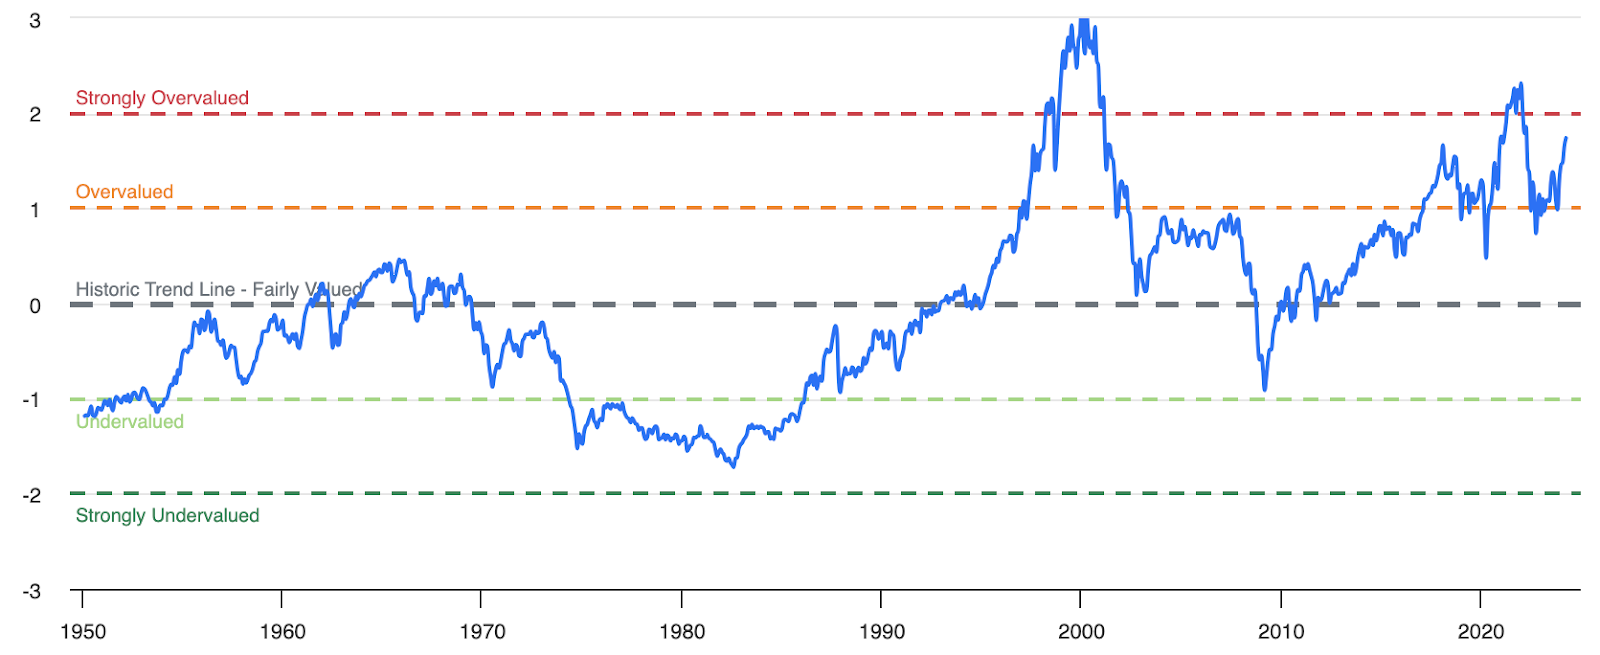
The CAPE P/E ratio, or Shiller P/E, is a 10-year cyclically and inflation-adjusted metric for assessing a stock's value. Robert Shiller developed it to filter out noise in corporate earnings.
The current S&P 500 10-year P/E ratio is 34.2, which is 68.7% above the modern-era market average of 20.3 and 1.7 standard deviations above the average. This indicates that the market is overvalued.
Source: currentmarketvaluation.com
Magnificent 7
The US market increasingly relies on the Magnificent 7 mega-cap tech stocks—Microsoft, Apple, NVIDIA, Alphabet, Amazon, Meta Platforms, and Tesla—which comprise around 29% of the S&P 500's market cap.
These leading companies essentially represent the US stock market. Collectively, they accounted for 37% of the S&P 500's 10.2% gain in the first quarter.
Their average TTM P/E ratio is around 42, while the next 18 largest US stocks average around 80, significantly above the historical bubble threshold of 28x.

Source: SeekingAlpha
Other than Tesla (TSLA), which is down almost 60%, all are within 9% of all-time highs.
Potential Earnings Slow Down
A downturn in the performance of these seven stocks could significantly impact the overall market.
Currently, these companies are supported by strong EPS momentum while the rest of the market lags. Their average YoY earnings have grown 220% in the last twelve months, driven mostly by NVIDIA. Forward expectations are for “only” 31% growth— again driven mostly by NVIDIA.
Their valuations appear stretched, making it harder to meet or exceed consensus price targets going forward.
Comparison to the Dot-Com Bubble
Harvard researchers have defined a bubble as a 100%+ increase in an asset’s price in the previous two years, followed by a 40% crash over the following two years.
So, how does it apply to the current market? The S&P 500 is up 32% in the last two years, so no technical bubble is forming yet.
How about the Magnificent 7? They’re up just over 50% in the last two years, so again, there is no technical bubble there yet, either.

Magnificent 7 Performance, Source: Portfolio Visualizer
Unlike the late 1990s, today's technology sector surge is supported by significant growth in profitability. While reminiscent of the dot-com era, the current market benefits from much stronger fundamentals.
The Magnificent 7 are real companies, the greatest in history, in fact, with hundreds of billions of combined operating cash flows. They’ve become the new de facto “flight to safety” stocks for some money managers.

Source: SeekingAlpha
Additionally, substantial liquidity in money market funds could flow back into risk assets if the Fed cuts rates, indicating no immediate bubble in the stock market.
Inflation
Despite high bond yields, the elevated premiums for stocks, particularly the Magnificent 7, suggest vulnerability if inflation stays high and bond yields keep rising. Recent hotter-than-expected PPI data amplify this concern. CPI remained fairly steady at 3.4% this week, making the Fed unlikely to raise or cut rates anytime soon.
What Can Investors Do?
Let’s be clear: stocks are priced to perfection right now. While not in a technical bubble, stocks are priced at the high end of their historical valuation range.
Historically, 10-15-year returns from these levels have been underwhelming. GuruFocus estimates 0.8% annual returns from here.
Earnings may continue to grow, but operating margins may come under pressure in the next several years, especially if inflation persists, there’s a recession, or AI doesn’t deliver the productivity or margin gains promised.
That’s why, as value investors, we prefer to pick our spots. That’s why Buffett is holding nearly $200 billion in cash.
You can wait for Q2 earnings to see if these seven companies meet expectations and how the market reacts. Developments in AI could boost profitability, but much of this potential may already be priced in.
It’s worth adding exposure to U.S. equities beyond the Magnificent 7 and favoring value over growth stocks now. Until the Fed cuts rates, consider sectors like financials, industrials, utilities, consumer staples, and healthcare.
In partnership with

Seeking Alpha is our favorite investment news and research platform. We love their stock selection service, Alpha Picks, so much that we subscribe to it ourselves.
Alpha Picks by Seeking Alpha has beaten the market, and now you can follow along in your own portfolio.
What’s included?
2 monthly, data-driven stock picks
Alpha Picks Model Portfolio access—perfect for long-term investors
Live model portfolio tracking, updated daily
Sell and new position alerts
Detailed research on every pick so you can learn and become a better investor as you follow along
We've arranged a special discount for you as a newsletter reader. Save 10% ($50) when you subscribe today.
What are the results so far?

Source: Seeking Alpha, Alpha Picks
As of the most recent update, the Alpha Picks model portfolio is up over 124%, compared to 38% for the S&P 500 in the same time period.
There is no guarantee of future returns, but since launching the service, those are the real results of the model portfolio.
Why else do we love Alpha Picks?
Uses a data-backed system to enter and exit positions
Every pick is filtered with Seeking Alpha’s proprietary Value, Profitability, and Growth scores
In-depth write-ups for every position, entry, and exit
Educational webinars with portfolio deep dives
Diversified portfolio with many picks covered and tracked for you
Here’s what the portfolio dashboard looks like inside:

Inside Alpha Picks
Free bonus:
For the next 50 people only, when you subscribe to Alpha Picks, send us your receipt, and we'll give you a free copy of our new special report: A Simple Screener To Find High-Quality Value Opportunities ($199 value).
Do something nice for yourself and sign up for Alpha Picks now—we know you’ll truly enjoy reading their picks!