- Value Investor Daily
- Posts
- Value Investor Daily #20
Value Investor Daily #20
ULTA Beauty - Stock Down 30%, Slowing Growth, Is This Compounder Dead?
Since the beginning of April, Ulta Beauty's (ULTA) stock has experienced a sharp decline, dropping more than 24% due to management's cautious commentary at a competitor conference, which highlighted significant industry and competitive challenges.
The stock dropped more than 30% from its 52-week high eight weeks ago, falling from a market cap of $27.5B to $19.25B.
Ulta Beauty’s Relative Strength Index (RSI) stands at 33.57. This value suggests that the stock is nearing oversold territory, which typically indicates that a stock may be undervalued and be poised for a rebound.
Let’s investigate whether this steep decline represents a compelling buying opportunity for investors.
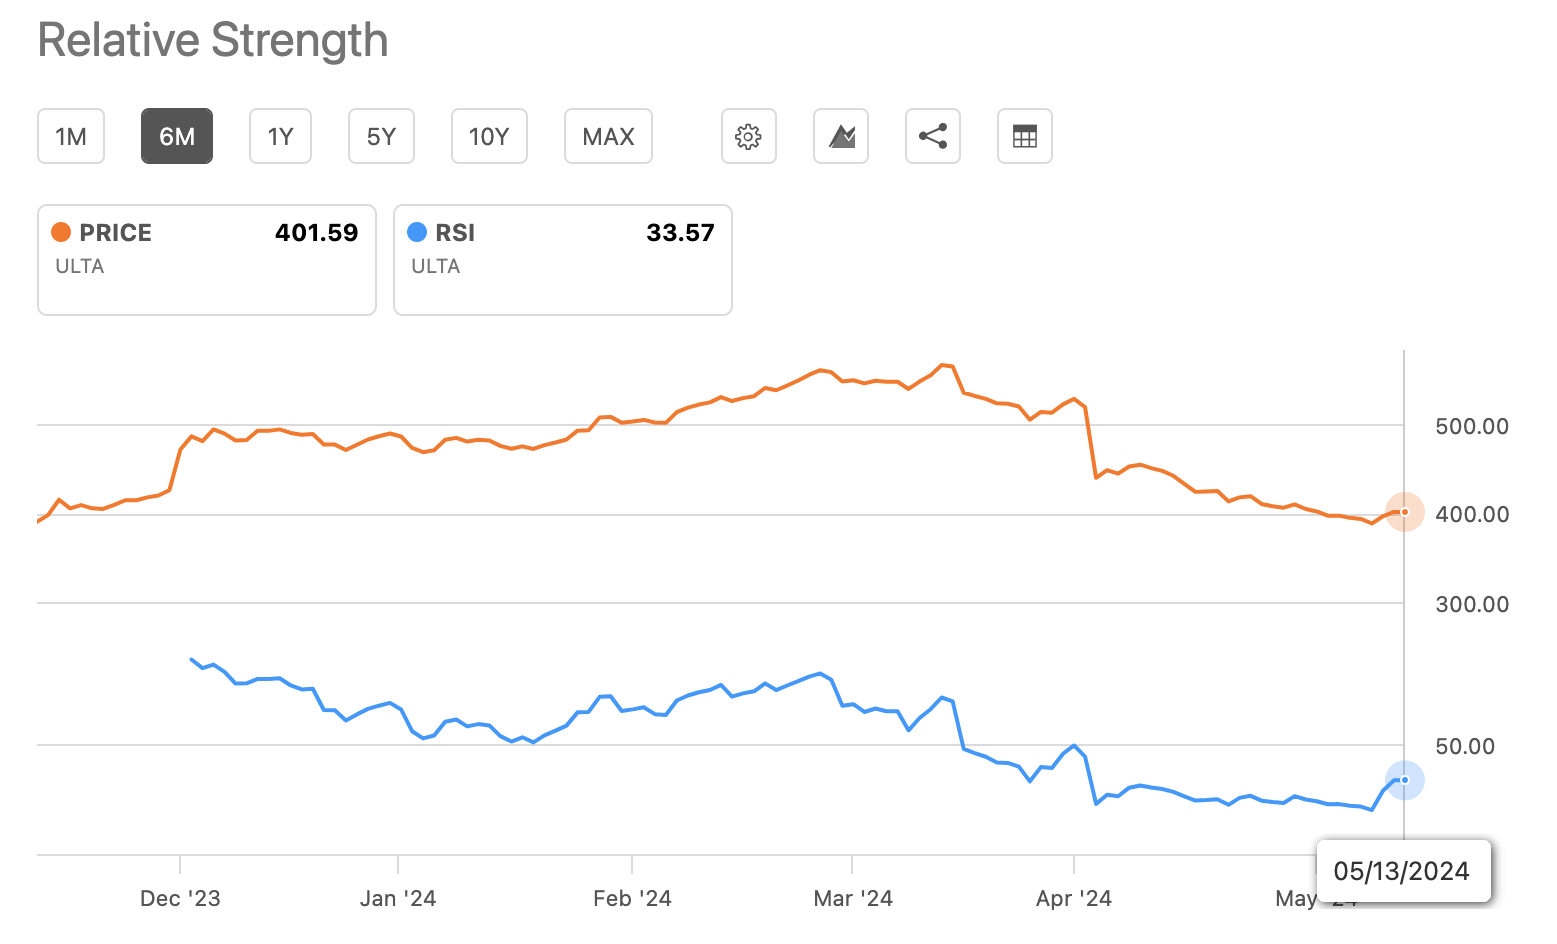
Source: Seeking Alpha
What Happened?
On April 3, Ulta Beauty's stock took a sharp dive, dropping over 15%, and has declined more since.
This drop followed management's remarks on a slowdown in price points and segments across the total category.
They highlighted an intensely competitive landscape, especially impacting their prestige makeup and hair product market share.
The company now anticipates only moderate growth, expecting mid-single-digit percentage increases in its total category—a significantly slower pace than the robust growth seen in previous years.
Ulta has compounded rapidly in the last decade, growing revenues 3.5-fold from $3.2 billion in 2015 to $11.2 billion in the last twelve months.
But growth has slowed more recently. EPS growth has slowed to 8.4% YoY, a far cry from the 23.5% pace over the last ten years, and revenue growth has slowed from 15.4% down to 9.7% today.

Slowing earnings and cash flow vs. 10-year average. Source: SeekingAlpha
Additionally, the company reaffirmed its full-year fiscal 2024 guidance issued on March 14 during its Q4/23 financial results announcement.
The guidance projected lower annual profit than Wall Street expectations. Rising supply chain costs and increased promotional activities have compressed margins.
Furthermore, the forecast for comparable sales growth has been adjusted downward slightly, now set at 4% to 5%, compared to the previously estimated 5% to 5.5%.
The operating margin forecast has also been revised. Margins are expected to be between 14% and 14.3%, a decrease from the earlier range of 14.6% to 14.8%.
Analyst Reactions
In April, numerous Wall Street analysts revised their ratings and price targets for Ulta Beauty.
Barclays adjusted its rating from Overweight to Equal Weight and reduced its price target from $612 to $434 per share.
They cited a shift to a more cautious stance in the near term due to increased competition, a noticeable slowdown in year-to-date comparable sales, heightened promotions, and potential risks to second-half guidance.
Despite these concerns, they acknowledged Ulta Beauty's long-term potential as a leading multi-brand retailer in the expanding beauty sector.
Jefferies also changed their rating from Buy to Hold, noting a cautious outlook on Ulta Beauty's mid-single-digit comparable sales growth, maturing brand mix, and normalization within the category.
They highlighted that Ulta has been losing market share in key high-margin areas like prestige cosmetics and hair products.
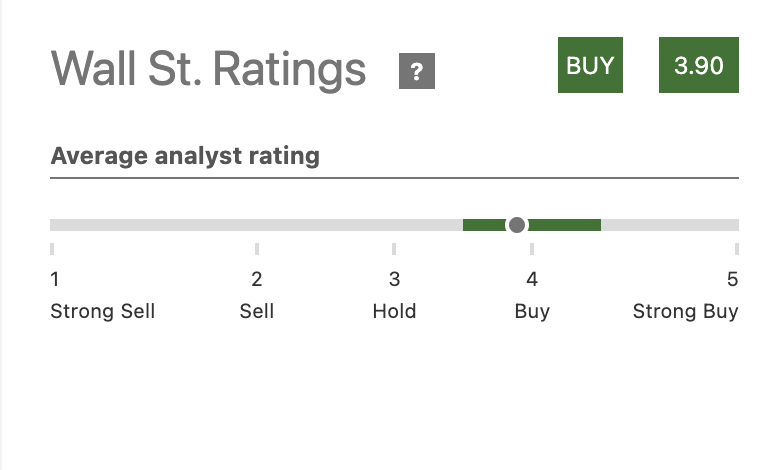
Despite these downgrades and revisions, Wall Street consensus, according to Seeking Alpha, maintains an average Buy rating on Ulta Beauty.
Price targets range from $350 to $690, with a median of $547.58, which suggests a potential 34% upside from the current price level.
Source: Seeking Alpha
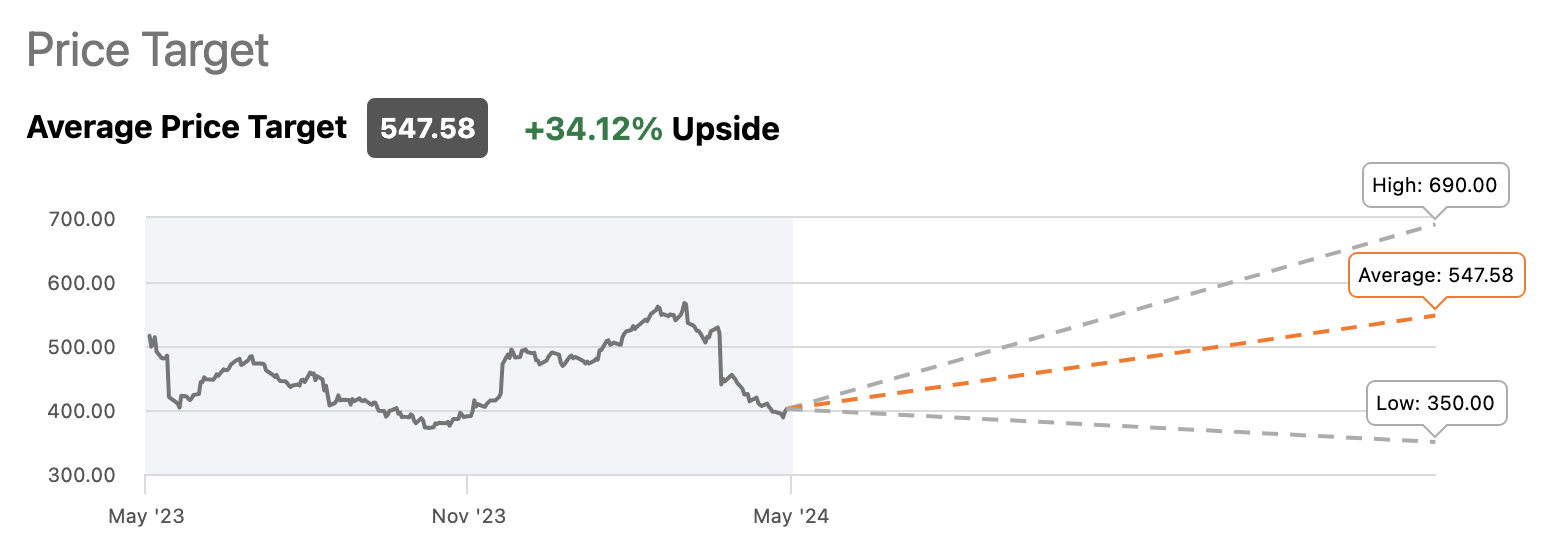
Source: Seeking Alpha
Latest Earnings and Outlook
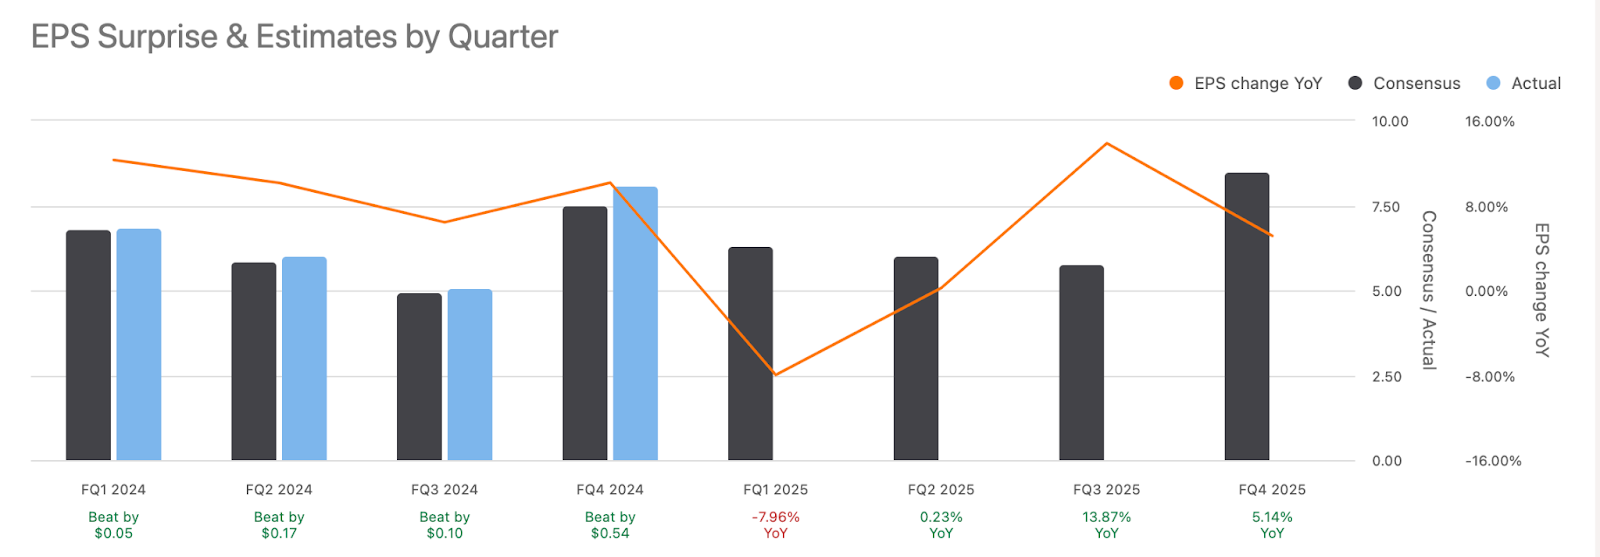
On March 14, Ulta Beauty released its Q4 earnings, surpassing Wall Street's expectations and extending its streak of quarterly EPS beats that began in Q2/21.
The company reported an EPS of $8.08, $0.56 higher than the analyst estimate of $7.52. Revenue was $3.6 billion, exceeding the Street estimate of $3.53 billion.
Although comparable sales grew by 2.5%, this was a substantial decline from the previous year’s growth of 15.6% but still slightly better than the forecasted 2.23%.
Despite the earnings beat, the company’s shares dropped by 5% the following day, as the soft guidance overshadowed the strong Q4 results.
Ulta Beauty is scheduled to report its Q1/25 earnings on May 30. Current Wall Street estimates project an EPS of $6.30 and revenues of $2.73 billion.
Source: Seeking Alpha
Ahead of Earnings Results
Following cautious commentary at a competitor conference in early April regarding industry and competitive challenges, Oppenheimer analysts expect Ulta Beauty's management to revise its full-year guidance downward.
The analysts believe that management might lower the fiscal 2024 EPS guidance from the current range of $26.20-$27.00 to closer to their revised estimate of $25.00, compared to a consensus figure of $26.61. Oppenheimer views a more conservative guidance update as both prudent and anticipated by market participants.
Currently, Ulta Beauty’s shares are trading at approximately 16 times Oppenheimer’s updated 2024 earnings estimate, which is close to the historical low levels in the mid-teens and almost half of the 5-year average of 30.
Based on a review of historical trends, Oppenheimer suggests that a potential bottom for the stock could be forming in the $370 range.
Despite the prevailing negative sentiment around Ulta Beauty's shares, Oppenheimer advises positioning to take advantage of any potential price dips.
Valuation
Our fair value estimate also suggests that now may be an opportune time to buy shares of Ulta Beauty. We utilized various models to determine the fair value of Ulta Beauty, including:
Earnings Power Value: $445.55
EV/Revenue Multiples: $433.10
EV/EBITDA Multiples: $445.33
Price/Book Multiples: $403.80
P/E Multiples: $445.21
Price/Sales Multiples: $434.30
5-Year DCF Revenue Exit: $461.94
5-Year DCF EBITDA Exit: $476.82
The average fair value calculated from these models is approximately $443, indicating a potential upside of about 10% from current levels.
The road could be bumpy, and we would prefer a higher margin of safety, but in the long run, if management can return the company to growth, the stock should turn around.
It will likely require 1-3 years of patience, as comps will take a while to rebound. But that sort of time horizon is table stakes for value investors.
Management Outlook
Current store count - 1,355
Management plans to remodel existing stores and open new ones. In the long run, they plan to reach 1,500-1,700 stores in the US.
The stock is down, and growth has slowed, but the underlying business continues to perform.

Source: SeekingAlpha
ROIC - 26%
ROE - 60%
Net debt - $1.14B
Total long-term debt - $1.91B
Free cash flow - $783M
LT debt to free cash flow - 2.44x
Current share buyback authorization - $2B. Management has reduced the share count by 24% since 2015. The stock pays no dividend.
One final note: Ulta knows how to grow its customer base. Ulta's rewards program now has 43 million members, 26% more than Sephora's.

In partnership with

Seeking Alpha is our favorite investment news and research platform. We love their stock selection service, Alpha Picks, so much that we subscribe to it ourselves.
Alpha Picks by Seeking Alpha has beaten the market, and now you can follow along in your own portfolio.
What’s included?
2 monthly, data-driven stock picks
Alpha Picks Model Portfolio access—perfect for long-term investors
Live model portfolio tracking, updated daily
Sell and new position alerts
Detailed research on every pick so you can learn and become a better investor as you follow along
We've arranged a special discount for you as a newsletter reader. Save 10% ($50) when you subscribe today.
What are the results so far?

Source: Seeking Alpha, Alpha Picks
As of the most recent update, the Alpha Picks model portfolio is up over 124%, compared to 38% for the S&P 500 in the same time period.
There is no guarantee of future returns, but since launching the service, those are the real results of the model portfolio.
Why else do we love Alpha Picks?
Uses a data-backed system to enter and exit positions
Every pick is filtered with Seeking Alpha’s proprietary Value, Profitability, and Growth scores
In-depth write-ups for every position, entry, and exit
Educational webinars with portfolio deep dives
Diversified portfolio with many picks covered and tracked for you
Here’s what the portfolio dashboard looks like inside:

Inside Alpha Picks
Free bonus:
For the next 50 people only, when you subscribe to Alpha Picks, send us your receipt, and we'll give you a free copy of our new special report: A Simple Screener To Find High-Quality Value Opportunities ($199 value).
Do something nice for yourself and sign up for Alpha Picks now—we know you’ll truly enjoy reading their picks!